Creating Energy Band Diagrams for Solar cells and LED
Posted on Mon 11 September 2017 in Misc
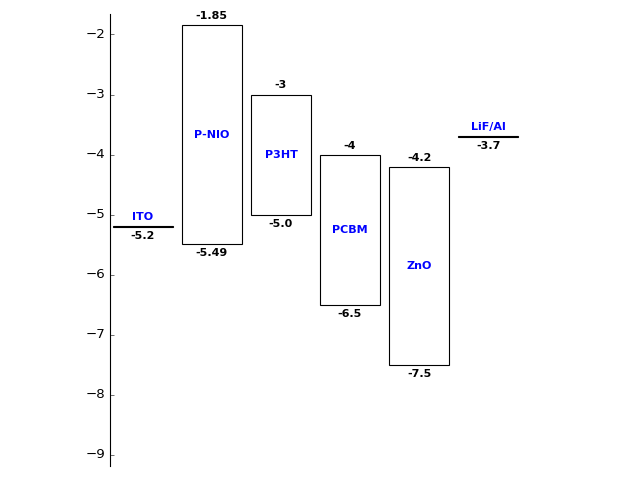
Energy band diagrams are used to visulize the electron and hole transport in Solar cells and LED research. I want to quickly draw them and came up with a python module.
Here's an example on how to use this code.
1 2 3 4 5 6 7 8 9 10 11 12 13 14 15 16 17 | |
will result in the following plot
You can download it at my github repository.